
Factors associated with dental care utilization among Iranian adult populations based on Anderson model | BMC Public Health

This cross-sectional house-to-house study was conducted in Isfahan Province, Iran, between August and November 2022. The participants were recruited from 18–44-year-old adults living in two cities of Isfahan Province Under the coverage of the HTP (UHTP)(i.e., Ashtarjan and Pirbakran). The HTP non-exposed (comparison) group members were recruited from neighbor cities with similar socioeconomic status but Outside the coverage of the HTP in Isfahan Province (OHTP)(i.e., Yazdabad and Kelishad). The cities were selected in consultation with the Isfahan Province Health Deputy. The study protocol was approved by the Ethics Committee in the Vice Chancellery of Research at the Isfahan University of Medical Sciences. (IR.MUI.RESARCH.REC.1400.383). In addition, the necessary permits and approvals to enter homes in the respective areas were obtained from municipalities and other related governmental organizations. In each house, the investigators (one examiner and an assistant) offered the permits and gained written consent informs.
Sample size and sampling method
The structural equation modeling (SEM) was used to determine the minimum sample size. As recommended by Comrey and Lee [16], the sample size needed to be considered 5 to 15 times larger than the variables. In this study, the minimum required sample size was 630 that is 15 times larger than the number of variables (i.e., 42). However, including the expected unusable questionnaires (about 15%), we conducted our study among about 720 people. Finally, 704 individuals were recruited and had valid filled-out questionnaires.
Multistage sampling was used in this study. In consultation with the Isfahan Province Health Deputy and Oral Health Office, two cities of Ashtarjan and Pirbakran covered by the HTP and two other cities of Yazdabad and Kelishad with similar socioeconomic status but outside the plan were selected. These cities are all settled in the province of Flavarjan, one of the provinces out of 10 in Isfahan where the HTP was implemented in the country. This province was selected randomly. In each region, five streets were randomly selected from the city road maps. On each street, the first house was selected randomly. In each house, one person was then recruited from the residents aged 18–44 years based on the KISH GRID sampling framework [17]. In this framework, the row represents the number of families examined, whereas the column shows the number of eligible people (e.g., over 18 years old) in a family. The crossover point of a row and a column indicates who will be examined in each house. The response rate was between 80 and 90% in one or two home visits (at noon and in the afternoon) based on the KISH GRID framework, and we had to replace them in 10–20% of cases.
Inclusion and exclusion criteria
Individuals in age group of 18–44 years who has been living in the included regions for at least from five years ago and were willing to participate were recruited. People who were not agree with the oral health examinations or to complete the questionnaire were excluded.
Factors
According to Anderson’s model of healthcare utilization [9], the proposed factors were classified under contextual, individual predisposing, individual enabling, and individual need categories (Fig. 1). To identify the best indicators for each category, a comprehensive scoping review was performed including studies published between 1968 (the time when the first model was proposed) and 2021. All the measures used in studies about the utilization of dental care based on Andersen’s model were then retrieved. The review results were previously published [4]. Accordingly, for each category, some common indicators were selected, and the final questionnaire was validated concerning the opinions collected from an eight-member panel including four dental public health, two health policy, and two health management experts. Based on the Waltz and Bausell technique [18], the relevancy of questions was scored from “completely not relevant” (1 point) to “completely relevant” (4 points). The clearance and simplicity of questions were also assessed using the same four-point Likert scale. The content validity index (CVI) was determined by dividing the frequency of the scores of 3 and 4 for each question by the total number of the panel of experts. According to the Lawshe Table [19], the cutoff point of 0.75 was considered the minimum acceptable CVI mean. For all questions, the mean score was higher than or equal to 0.85. The CVR (Content Validity Ratio) was evaluated by asking the panel about the necessity of the questions. The mean for all questions was set at ≥ 0.9 through the following CVR formula:
$$ \rmCVR = \frac{\rmn_\rmE\rm – N/2}\rmN/2 $$
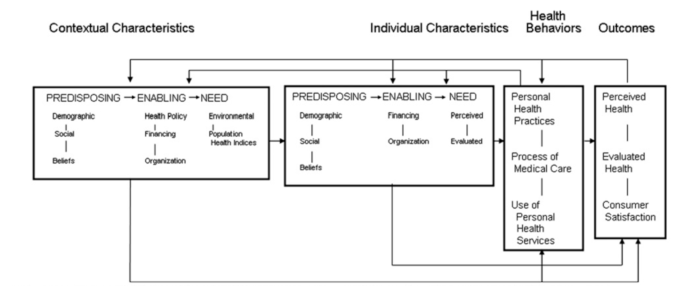
The conceptual model of the study. The Phase 5 of the Anderson model. Adopted from Andersen RM. National health surveys and the behavioral model of health services use. Medical care. 2008;46 [7]:647 − 53
To evaluate the reliability of questions on behavior and practice, the test-re-test method was implemented on 50 patients referring to the Dental School of Isfahan University of Medical Sciences, Isfahan. The intra-class coefficient (ICC) was measured at 0.8–1 for practice questions. Cronbach’s alpha was calculated for the attitude questions (i.e., the value of oral health and attitude toward the importance of regular dental visits). It was higher than 0.7. Consisting of 42 items, the finalized self-administrative questionnaire was provided to the participants (supplementary file 1). The final considered measures were as follows:
Contextual factors
The status of the individuals’ region of living including UHTP versus OHTP was considered as the main contextual factor. The number of dentists per 100,000 people in the selected regions was also measured based on the records available in the Heath centers. In addition, the questions regarding access to care were included, and the participants were asked, “In case of necessary dental treatment needs over the year, did you access a dentist? How long did it take to reach a dentist or a dental clinic? How long did you need to wait in the waiting room? In emergencies, how long did it take you to visit a dentist?” The questions and summarization methods were based on the study by Eslamipour et al. [20].
Individual predisposing factors
The predisposing factors included demographics (e.g., age, gender, state of residency (rural/urban), and marital status), social structure (e.g., occupation, household size, and education), and health beliefs (e.g., dental fear, perceived oral health status, and other health beliefs). To record the perceived oral health status, the participants were asked to rate it on a VAS 0–10 scale [21]. They were also asked to rate the oral health value in comparison with the general health on a Likert scale. Dental fear was asked by a dichotomous yes/no question, and the level of dental fear was asked to be rated on a VAS 0–10 scale [22].
Individual enabling factors
Some questions about the insurance coverage, insurance type, complementary insurance and the coverage of dental care by their insurance packages, asset index (owning a private car, a laptop, the number of rooms in the household and etc.), wealth index (having foreign entertainment travel in the past two years), were asked to assess the individual enabling factors. The income was not included in the questions, as the answers are not usually accurate. The questions about occupation, education, asset, and wealth indices were weighted, summed to make a summary measure of SES based on the study by Roohafza et al. [23]., and then classified as low, middle, and high SES (Socio-Economic Status).
Individual need factors
Two types of dental need were assessed among participants; the normative need or evaluated need, which was identified by the examiner based on the oral health status of the participants, and the self-perceived dental need. To evaluate the former, based on the clinical examination of the teeth and the symptoms of the patients based on the WHO basic method for oral health surveys [24], the normative need was recorded as no dental care need, need for routine dental care, and emergency dental treatments. All the examinations were performed by a dentist (ANZ) using a head light, disposable mirror and on a chair in the participants’ houses. The perceived need was asked by two questions of whether participants think of any kind of dental treatment they needed (yes/no) and what type of treatment they needed (restoration, root canal therapy, extraction, prosthodontic, orthodontic, implant and/or aesthetic treatments) [4, 24, 25].
Personal health behaviors or practices
Tooth brushing behavior, use of dental floss, and frequency of between-meal sugary snacks were asked by the WHO Adult Oral Health Assessment Questionnaires [24].
Outcome: dental care utilization
Dental care utilization was the outcome and was measured by adopting a dichotomous item about dental care over in recent year (i.e., “Have you been to the dentist during the past year? 0 = “no”; 1 = “yes”). This item was the most common variable defined to analyze the utilization of dental care based on our previous published scoping review [4]. The choice of service sector (public/private) and reasons for the referral (regular checkups / preventive care / routine care) were also asked.
Statistical analysis
Descriptive analytical tests (e.g., T-test, ANOVA, and chi-squared) were used. Simple logistic regressions were employed to assess the association of each factor with the outcome of utilization of dental care. Explanatory variables were considered for inclusion in the multiple logistic model when an association significant at 0.2 was obtained from the univariate analysis [26]. Then a forward and stepwise approach was used by adding explanatory variables gradually to keep only those associations significant at 5% until the best fit model was found. The data analysis was performed in SPSS 26.
link


