
Association of serum calcium levels with diabetic kidney disease in normocalcemic type 2 diabetes patients: a cross-sectional study

Research setting and population
We conducted a single-center, cross-sectional study in the Endocrinology Department at the Affiliated Hospital of Qingdao University from January 1, 2021, to December 1, 2022. This study included inpatients aged 18 years or older diagnosed with Type 2 Diabetes Mellitus (T2DM). The diagnosis of T2DM was established based on the American Diabetes Association’s guidelines, requiring at least one of the following criteria: (1) glycated hemoglobin (HbA1c) ≥ 6.5% (48 mmol/mol); (2) fasting plasma glucose (FPG) ≥ 7.0 mmol/L (126 mg/dL); (3) 2-hour plasma glucose ≥ 11.1 mmol/L (200 mg/dL) during a 75-g oral glucose tolerance test (OGTT); (4) random plasma glucose ≥ 11.1 mmol/L (200 mg/dL) in patients with classic symptoms of hyperglycemia or hyperglycemic crisis; (5) current use of antidiabetic medications15. The antidiabetic medications included: a) Biguanides (e.g., metformin)b) Sulfonylureas (e.g., glipizide, glyburide)c) Thiazolidinediones (e.g., pioglitazone)d) DPP-4 inhibitors (e.g., sitagliptin)e) GLP-1 receptor agonists (e.g., liraglutide)f) SGLT2 inhibitors (e.g., empagliflozin)g) Insulins.
We excluded patients with missing serum calcium or albumin levels, individuals with type 1 diabetes or other specific forms of diabetes, patients with end-stage renal disease (eGFR < 15 mL/min/1.73 m²) or those on dialysis, and conditions significantly affecting calcium metabolism (e.g., primary hyperparathyroidism, significant liver disease). Additionally, we excluded patients with recent use of medications known to significantly impact serum calcium levels, including calcium supplements, vitamin D preparations, thiazide and loop diuretics (e.g., hydrochlorothiazide, furosemide), bisphosphonates (e.g., alendronate), glucocorticoids (e.g., prednisone), lithium, teriparatide, denosumab, calcimimetics (e.g., cinacalcet), and certain anticonvulsants (e.g., phenytoin)16,17,18. “Recent use” was defined as administration within 30 days prior to serum calcium measurement. Additionally, we excluded pregnant women, patients with active malignancies or other severe consumptive diseases, as well as those with incomplete data regarding serum calcium, albumin, diabetes status, or renal function.Participant selection is detailed in Fig. 1.
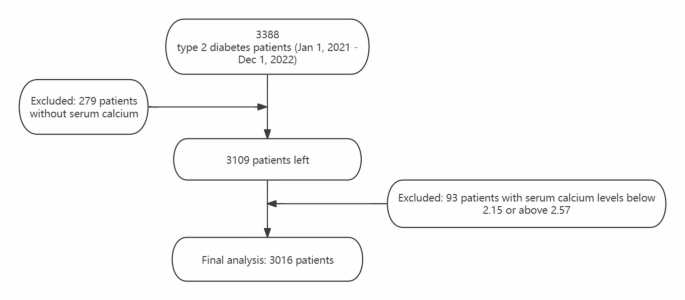
Flowchart of study population.
Measurement of serum calcium and albumin levels
Serum calcium levels were accurately measured using the Arsenazo III method and analyzed with a BS800 + ISE biochemical analyzer. Blood samples were collected after fasting, minimizing variations due to external factors like alcohol or medication. Albumin levels were determined using the bromocresol green method. We corrected serum calcium levels for albumin concentration using the formula: albumin-corrected calcium (mmol/L) = measured total calcium (mmol/L) + 0.02 × [40 − albumin (g/L)]19.
DKD status assessment
Diabetic Kidney Disease (DKD) in this study was identified based on chronic kidney disease attributed to diabetes, characterized by a urinary albumin-to-creatinine ratio (UACR) ≥ 30 mg/g and/or an estimated glomerular filtration rate (eGFR) < 60 mL/min/1.73 m2, persisting for more than 3 months20. It is important to note that while DKD includes patients with eGFR < 60 mL/min/1.73 m², our study specifically excluded individuals with advanced renal disease, defined as an eGFR < 15 mL/min/1.73 m² or those requiring dialysis. This exclusion criterion was implemented to avoid confounding effects from severe renal impairment on serum calcium metabolism. eGFR was calculated using the formula by Andrew S. Levey et al.21.
Covariates
The study collected various covariates, including demographic and clinical data such as gender, age, diabetes duration, and complications. Anthropometric measurements included height, weight, and body mass index (BMI), calculated as weight in kilograms divided by height in meters squared. Lifestyle factors assessed were smoking and alcohol consumption, with alcohol consumption defined as consuming at least 30 g of alcohol weekly for a year or more, and smoking defined as having smoked at least 100 cigarettes in one’s lifetime22. Biochemical analyses involved fasting blood samples for lipid profiles, creatinine (Cr), uric acid (UA), fasting plasma glucose (FPG), liver function tests, glycosylated hemoglobin (HbA1c), and urinary albumin excretion rate (UAER), with all tests, except for HbA1c, performed using the Hitachi 7600 analyzer. Fatty liver diagnosis was based on ultrasound findings23. Hypertension was defined as having a systolic blood pressure (BP) ≥ 140 mmHg, diastolic BP ≥ 90 mmHg, or current use of antihypertensive medication24. Diabetic retinopathy (DR) assessment utilized a slit lamp microscope and optical coherence tomography, with diagnoses made by an ophthalmologist based on funduscopic examination findings, categorizing patients as having DR (including proliferative and non-proliferative changes) or not25. Diabetic peripheral neuropathy (DPN) diagnosis was based on clinical symptoms, neurological examinations, and nerve conduction studies26.
Statistical methods
Participant baseline characteristics are presented as means ± standard deviations for normally distributed variables, median (Interquartile Range (IQR))for skewed variables, and percentages for categorical variables. The Chi-square (χ2) test, Student’s t-test, and Mann-Whitney U test were used to analyze differences in diabetic nephropathy status among categorical, normally distributed, and skewed variables, respectively. Univariate logistic regression models evaluated the association between corrected Serum Calcium levels (per 0.1 change) and Diabetic Kidney Disease (DKD).Our analysis comprised unadjusted, minimally adjusted (Model I adjusting for age, sex, BMI), and fully adjusted models (Model II incorporating DKD-related variables identified in univariate logistic regression).To assess potential non-linear relationships, we employed Generalized Additive Models (GAM) using the ‘mgcv’ package in R. The model is expressed as: g(E(Y)) = β₀ + s(calcium) + s(age) + s(BMI) + βX.Where Y represents DKD presence/absence, g() is the logit link function, s() denotes smooth functions using thin plate regression splines, and X represents other covariates. Smooth terms were constrained to a maximum of 10 degrees of freedom, with optimal smoothing determined by generalized cross-validation. The calcium-DKD relationship was visualized using partial effect plots with 95% confidence intervals. Stratified binary logistic regression models were used for subgroup analyses. All analyses were conducted using R (The R Foundation) and EmpowerStats ( X&Y Solutions, Inc., Boston, MA). Statistical significance was set at a two-sided P-value < 0.05.
link


