


Study design and population
CMEC is a community-based natural population cohort study, and its detailed study design, sampling methods, and baseline population characteristics have been published in the International Journal of Epidemiology and the Chinese Journal of Epidemiology [26, 27]. Briefly, from May 2018 to September 2019, we recruited 99,556 participants aged 30-79 years old in five provinces in Southwest China (i.e., Yunnan, Guizhou, Tibet, Sichuan, and Chongqing) and obtained detailed data on each participant through face-to-face questionnaires, fasting blood tests, and relevant physical examinations (including abdominal ultrasound). In this study, we further excluded participants with no abdominal ultrasound findings (n = 4,572), missing more than two indicators to assess LE8 (n = 1,479), and missing relevant covariates (n = 208). Ultimately, 93,297 participants were included in our main analysis (Fig. 1). This study was conducted in accordance with the Declaration of Helsinki and was approved by the Medical Ethics Review Committee of Sichuan University (K2016038, K2020022). Meanwhile, prior to the survey, all participants signed a written informed consent form.

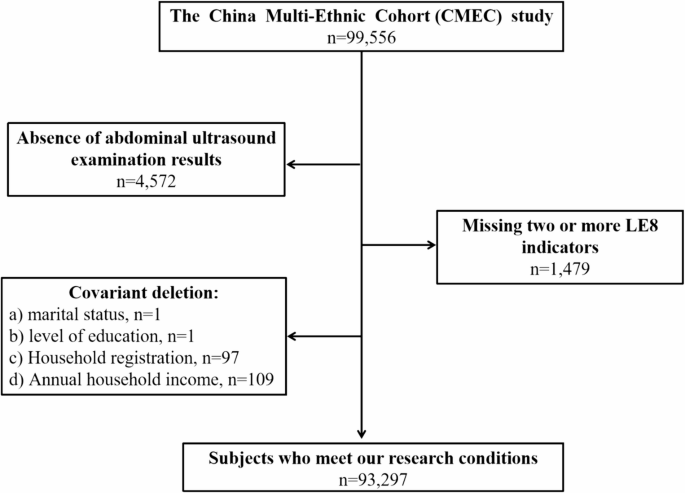
Flow chart of the analysis sample in the study
Measurement of LE8
Each participant’s LE8 score was calculated based on four health behaviors (diet, Physical Activity[PA], nicotine exposure, sleep) and four health factors (Body Mass Index[BMI], blood pressure, blood glucose, Non-High Density Lipoprotein Cholesterol Level[Non HDL-CL]) recommended by the AHA [13]. In the CMEC baseline survey, the Food Frequency Questionnaire (FFQ) was used to assess participants’ habitual Dietary intake over the previous 12 months. The FFQ included a List of 13 common food items: tubers, red and processed meats, poultry, fish/seafood, eggs, fresh vegetables, soybean products, preserved vegetables, fresh fruits, dairy products, rice, wheat products, and roughage. Participants reported the consumption of each food group in terms of quantity (how many grams per meal based on standard portion sizes) and frequency (how often they consumed it daily, weekly, monthly, or annually in the past 12 months). For oil and salt, we looked up the household consumption and the number of persons eating each meal in the past month and calculated the daily consumption of cooking oil and salt for each person. Reproducibility and validity of the FFQ have been previously reported [28]. We used the scoring method of diet pattern of the Dietary Approaches to Stop Hypertension (DASH) to evaluate the participants’ diet quality [13]. Specifically, the DASH focuses on eight food components, including fresh fruits, fresh vegetables, nuts and legumes, dairy products, whole grains, salt, oil, and red meat and its products. Participants were divided into quintiles based on their ranking of food intake in each group. The principle of positive scoring was used to assign scores to the intake of five foods, including fresh fruits, fresh vegetables, nuts and legumes, dairy products, and whole grains (e.g., Quintile 1 scored 1 point and quintile 5 scored 5 points) since these foods are recommended for greater intake. However, low intake of salt, oil, and red meat and its products was preferred, and thus they were assigned a reverse score, whereby quintile 1 was given 5 points, whereas quintile 5 was given 1 point. The scores for each component were finally summed to obtain a total Dietary score of 8-40 (In the supplementary material, Table S1 details the DASH diet scoring criteria). For the PA of the study participants, we referred to the validated questionnaire questions from the China Kadoorie Biobank [29]. Briefly, we asked study participants about the intensity and duration of four types of PA in the past Year, including occupation, transportation, household chores, and leisure time. Referring to the 2011 update of the PA compendium, the daily exercise level for each PA was quantified through metabolic equivalent for tasks [30]. Specifically, an individual’s daily exercise level for each PA was calculated by multiplying the assigned Metabolic Equivalent for Task (MET) by the time spent on the activity. Finally, the calculated daily exercise levels for the four types of PA were summed to respond to the participant’s daily total PA level. Similarly, participants were categorized into quintiles based on their rankings of daily total PA levels. Regarding participants’ tobacco use, exposure to secondhand smoke and average sleep time per night were obtained from the“Smoking and Exposure to other environmental factors in the Individual”and“Life Events, Social Support, and Psychological Status” sections of the questionnaire, respectively. During the physical examination, after the subjects had taken a five-minute break, the examiner took three measurements of their blood pressure and measured their height and weight. The average of the three blood pressure measurements was used as the subject’s blood pressure level, and weight (kg) and height (m) were used to calculate BMI and classified according to the BMI criteria for Asian populations [13]. Biochemical markers such as Hemoglobin A1c (HbA1c), Total Cholesterol (TC), and High-Density Lipoprotein Cholesterol Level (HDL-CL) were obtained from fasting blood samples taken from subjects during the physical examination, whereas the non HDL-CL was calculated by subtracting the HDL-CL from the TC. Table S2 in the supplementary material details the specific scoring algorithm for each indicator in LE8, in which we Made appropriate adjustments to the scores for the indicators of Diet, PA, and BMI, taking into account the actual situation in China. In short, each indicator has a score ranging from 0 to 100. Notably, the example provided by the AHA working group for calculating LE8 score allows for one of the eight indicators to be missing [13]. Therefore, in our study, participants who were only able to access seven of the assessment indicators in LE8 were also included in the analysis. Finally, an unweighted average of all indicator scores was calculated to derive the subject’s LE8 score, and based on AHA’s definitions, LE8 score between 80 and 100 were defined as high CVH and 50-79 and 0-49 were defined as moderate and low CVH, respectively [13]. In addition, based on Rong Huai Zhang et al., [31] we used the same cutoff values of LE8 to categorize the two dimensions of health behaviors and health factors to investigate the association of LE8 subscales with kidney stones.
Diagnosis of kidney stones
A portable diagnostic ultrasound device (abdominal probe model C5-1; frequency 3.5-5.5 MHz) of the Volusone model of the American General Corporation was used to diagnose kidney stones in the subjects. Abdominal ultrasound is a very common form of health screening in China. Prior to the investigation, the research team trained experienced sonographers and standardized the diagnostic criteria for kidney stones, i.e., kidney stones were diagnosed when bright echogenic structures were demonstrated in the ultrasound images of the kidneys [32]. In addition, subjects were asked to fast for more than 8 h before the examination to minimize unnecessary interference.
Assessment of covariates
Based on relevant research evidence, in this study we defined some covariates as follows. (a) Sex: male and female; (b) Age group: ≤50 and > 50 years old; [33] (c) Ethnic group: Sichuan Basin and Yunnan-Guizhou and Qinghai-Tibet Plateau; (d) Household registration: rural, urban, and united; (e) Marital status: married/cohabiting, divorced/widowed, and never married; (f) Level of education: junior high school or below, senior high school, junior college, and bachelor degree or above; (g) Household Annual income(Ұ): < 20,000, 20,000-59,999, 60,000-99,999 and ≥ 100,000; (h) Frequency of tea drinking: The questionnaire asked “Have you been drinking tea every week for more than six months” and “If yes, how many days per week on average have you been drinking tea in the past year”, obtaining the tea drinking frequency as “never”, “1-2 days per week”, “3-5 days per week” and “almost every day”.
Statistical analysis
Continuous and categorical variables were statistically described using means and standard deviations, numbers and percentages, respectively, and t-tests and chi-square tests were used to explore differences between subgroups, where appropriate. Multifactorial logistic regression analysis was used to analyze the relationship between single indicator, LE8 and its subscale scores and kidney stones, where multiplicative interaction test studies were further used to explore the interaction between Health behaviors and Health factors. In this process, we built three adjustment models to adjust for known or possible confounders stepwise. Model 1 was unadjusted, Model 2 was adjusted for sex and age, and Model 3 was further adjusted on the basis of Model 2 for ethnic group, household registration, marital status, education, annual household income, and tea drinking frequency. In addition, we further explored the potential dose-response relationship between LE8 and its subscale scores and the risk of kidney stones using restricted cubic spline regression analysis (four knots were chosen, where the knot positions were the 5th, 35th, 65th, and 95th percentiles of the scores, respectively). Subsequently, we stratified the analyses by sex, age group, ethnic group, household registration, marital status, education, annual household income, and tea drinking frequency and similarly used a multiplicative interaction test studies to explore the interaction between the stratification factors and LE8 score to analyze further the specific role of LE8 score on kidney stones among people with different characteristics. Finally, we excluded subjects with a history of CVD (including coronary heart disease and stroke) and incomplete LE8 assessment metrics (i.e., participants who obtained only 7 of the 8 assessment metrics) and performed sensitivity analyses to assess the robustness of the study results. The results of the logistic regression analyses were reported as Odds Ratios (OR) and their corresponding 95% confidence intervals (95% CI). All statistical tests were two-sided and were considered statistically significant when P < 0.05. SPSS 26.0 and R 4.2.3 were used to perform all statistical analyses.
link